Visualizing Data
There's many ways to visualize your data in Data-Forge Notebook, lets look at a few here.
Use console.log to output whatever you want:
const data = "Whatever you want to log!";
console.log(data);
Whatever you want to log!
We can use the display function for formatted data visualization.
We can use it to visualize JavaScript arrays:
const data = [1, 2, 3, 4];
display(data);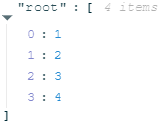
We can also use the display function to visualize JavaScript objects:
const data = { A: 1, B: "hello" };
display(data);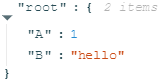
Use the display function and table plugin to visualize a JavaScript object as tabular data:
const data = { A: 1, B: "hello" };
display(data, "table");| Property | Value |
|---|---|
| A | 1 |
| B | hello |
Use the display function with the table plugin to visualize a JavaScript array as tabular data.
const data = [{ A: 1, B: "Hello" }, { A: 2, B: "Computer!" }];
display(data, "table");| index | A | B |
|---|---|---|
| 0 | 1 | Hello |
| 1 | 2 | Computer! |
Use the display function with the json plugin to render JSON text as structured data without having to parse it.
const data = '[ { "A": 1, "B": "Hello" }, { "A": 2, "B": "Computer!" } ]';
display(data, "json");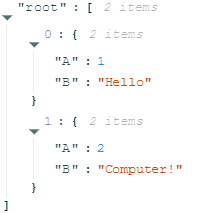
Use display to print pre-formatted text to cell output.
const someText = "Hello!\nThis is some preformatted text with newlines baked in :)";
display(someText);
Hello!
This is some preformatted text with newlines baked in :)
Use the datakit library to read a CSV data file and view it as a table.
const datakit = require('datakit');
const data = await datakit.readCsv("./example.csv");
display(data.slice(0, 5), "table");| index | Name | Sex | Age | Height (in) | Weight (lbs) |
|---|---|---|---|---|---|
| 0 | Alex | M | 41 | 74 | 170 |
| 1 | Bert | M | 42 | 68 | 166 |
| 2 | Carl | M | 32 | 70 | 155 |
| 3 | Dave | M | 39 | 72 | 167 |
| 4 | Elly | F | 30 | 66 | 124 |
Use the datakit library to read a JSON data file and view it as a table.
const datakit = require('datakit');
const data = await datakit.readJson("./example.json");
display(data.slice(0, 3), "table");| index | Name | Sex | Age | Height (in) | Weight (lbs) |
|---|---|---|---|---|---|
| 0 | Alex | M | 41 | 74 | 170 |
| 1 | Bert | M | 42 | 68 | 166 |
| 2 | Carl | M | 32 | 70 | 155 |
Easily create charts from JavaScript data using the apex plugin with the display function.
const data = [50, 20, 10, 40, 15, 25];
display(data, "apex");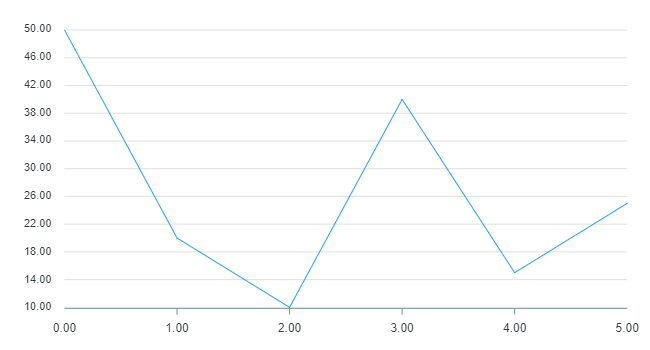
const data = [{ D1: 50, D2: 30 }, { D1: 20, D2: 200 }, { D1: 10, D2: 100 }, { D1: 40, D2: 400 }];
display(data, "apex");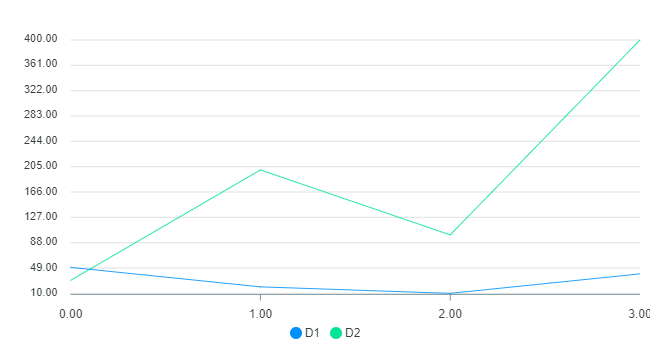
const data = {
    D1: [30, 10, 50, 15],
    D2: [300, 20, 10, 150],
};
display(data, "apex");
Easily load and plot CSV and JSON data with help of datakit on npm.
const datakit = require('datakit');
const data = await datakit.readCsv("./example.csv");
display(data, "apex");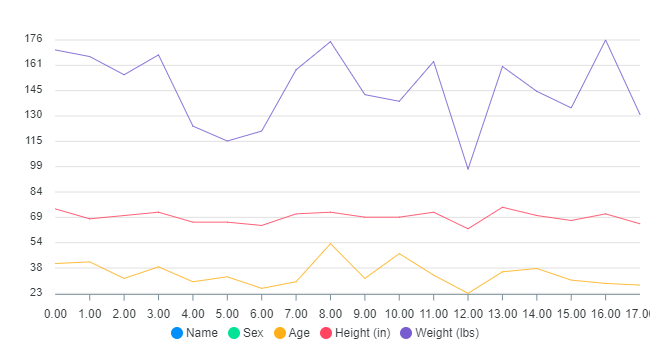
const datakit = require('datakit');
const data = await datakit.readJson("./example.json");
display(data, "apex");
Use the display function to plot geographic coordinates and GeoJSON!
display({
    location: [51.505, -0.10],
    zoom: 13,
    markers: [
        [51.505, -0.10],
        [51.5, -0.09],
        [51.51, -0.08]
    ],
}, "geo");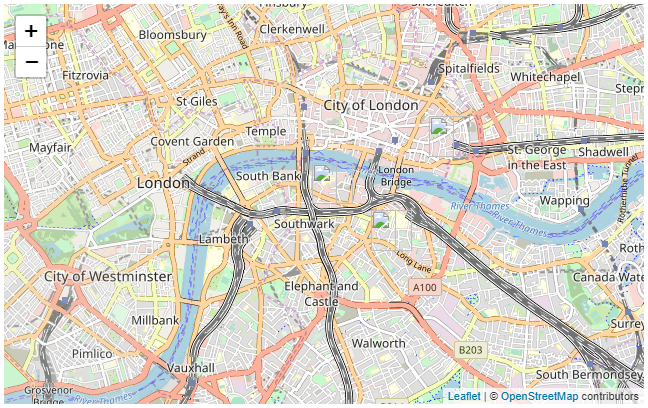
More visualization are coming in future editions of Data-Forge Notebook, for example:
- Images
- Node.js buffers
- Vectors, matrices and maths formulas
- Colors
Email and let me know what else could be added!